上一讲解读了TensorFlow的抽象编程模型。这一讲,我们上手解读TensorFlow编程接口和可视化工具TensorBoard。
TensorFlow支持C++和Python两种接口。C++的接口有限,而Python提供了丰富的接口,并且有numpy等高效数值处理做后盾。所以,推荐使用Python接口。
接下来,我们手把手教大家用Python接口训练一个输入层和一个输出层的多层感知器(MLP),用来识别MNIST手写字数据集。首先我们导入tensorflow库,下载文件到指定目录。
import tensorflow as tf
from tensorflow.examples.tutorials.mnist import input_data

# Download and extract the MNIST data set.
# Retrieve the labels as one-hot-encoded vectors.
mnist = input_data.read_data_sets("/tmp/mnist", one_hot=True)
其中read_data_sets()方法是tensorflow例子程序中提供的下载MNIST数据集的方法,直接使用就可完成数据下载。
接下来,我们需要注册一个流图,在里面定义一系列计算操作:
graph = tf.Graph()
# Set our graph as the one to add nodes to
with graph.as_default():
    # Placeholder for input examples (None = variable dimension)
    examples = tf.placeholder(shape=[None, 784], dtype=tf.float32)
    # Placeholder for labels
    labels = tf.placeholder(shape=[None, 10], dtype=tf.float32)

    weights = tf.Variable(tf.truncated_normal(shape=[784, 10], stddev=0.1))
    bias = tf.Variable(tf.constant(0.05, shape=[10]))
    # Apply an affine transformation to the input features
    logits = tf.matmul(examples, weights) + bias
    estimates = tf.nn.softmax(logits)
    # Compute the cross-entropy
    cross_entropy = -tf.reduce_sum(labels * tf.log(estimates),
    reduction_indices=[1])
    # And finally the loss
    loss = tf.reduce_mean(cross_entropy)
    # Create a gradient-descent optimizer that minimizes the loss.
    # We choose a learning rate of 0.05
    optimizer = tf.train.GradientDescentOptimizer(0.05).minimize(loss)
    # Find the indices where the predictions were correct
    correct_predictions = tf.equal(tf.argmax(estimates, dimension=1),
    tf.argmax(labels, dimension=1))
    accuracy = tf.reduce_mean(tf.cast(correct_predictions,
    tf.float32))
其中
graph = tf.Graph()
# Set our graph as the one to add nodes to
with graph.as_default():
这两句是定义流图并且,开始声明流图中的计算操作。
这里训练数据中, 样本是28*28的像素图片,标签label已经用10个比特表示,所以定义了placehoder:
# Placeholder for input examples (None = variable dimension)
examples = tf.placeholder(shape=[None, 784], dtype=tf.float32)
# Placeholder for labels
labels = tf.placeholder(shape=[None, 10], dtype=tf.float32)
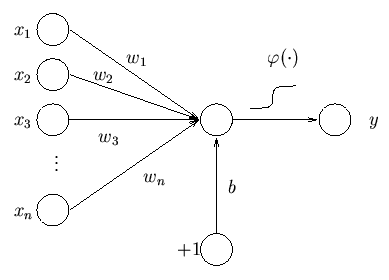
因为输入层和输出层之间连接,所以:
weights = tf.Variable(tf.truncated_normal(shape=[784, 10], stddev=0.1))
bias = tf.Variable(tf.constant(0.05, shape=[10]))
# Apply an affine transformation to the input features
logits = tf.matmul(examples, weights) + bias
estimates = tf.nn.softmax(logits)
其中权重矩阵weights就是一个784*10的矩阵,bias就是一个10个比特的向量。logits计算X·W+ b。estimates计算softmax激活函数。
我们的y预测计算完毕, 但是如何评估labels和y预测之间的差别 ? 这里, 不使用单纯的二次代价函数, 而是使用交叉熵代价函数. 实验证明, 交叉熵代价函数带来的训练效果往往比二次代价函数要好。参见: 交叉熵代价函数(作用及公式推导)
那么什么是交叉熵 ?
交叉熵 H(p, q) 可以理解为, 用伪造的模拟分布 q 去逼近真实分布 p 时, 需要使用的平均编码数 (非得和信息论扯上不是吗 ?).
一定能猜到, 编码数越小, q 就越接近真实分布 p. 事实上, 如果你的 q 非常非常接近 p 时, 那么你只要对p进行编码就行了, 所以 H(p, q)=H(p) 就是极限情况. 一般情况下 H(p, q)>H(p) . 参见: Cross entropy维基百科
其实TensorFlow代码计算交叉熵相当简单:
# Computes the cross-entropy and sums the rows
cross_entropy = -tf.reduce_sum(labels * tf.log(estimates), [1])
loss = tf.reduce_mean(cross_entropy)
流图构造的最后一步,就是选择一个“梯度下降”的最优化方法:
# We choose a learning rate of 0.05
optimizer = tf.train.GradientDescentOptimizer(0.05).minimize(loss)
# Find the indices where the predictions were correct
correct_predictions = tf.equal(tf.argmax(estimates, dimension=1),
tf.argmax(labels, dimension=1))
accuracy = tf.reduce_mean(tf.cast(correct_predictions,
tf.float32))
流图构造完毕, 接下来我们就该跑这个流图了:
with tf.Session(graph=graph) as session:
    tf.initialize_all_variables().run()
    for step in range(100001):
        example_batch, label_batch = mnist.train.next_batch(100)
        feed_dict = {examples: example_batch, labels:
        label_batch}
        if step % 100 == 0:
            _, loss_value, accuracy_value = session.run(
            [optimizer, loss, accuracy],
            feed_dict=feed_dict
            )
            print("Loss at time {0}: {1}".format(step,
            loss_value))
            print("Accuracy at time {0}:{1}".format(step, accuracy_value))
            print('\n')
        else:
            optimizer.run(feed_dict)
没错,告诉一个Session你要跑的流图。 然后,初始化变量,在迭代中跑流图。记住:每次调用session.run()你只是把流图跑了一遍而已,即,数据在流图中只流了一遍。完整可以运行代码见文末。
除了方便的python编程接口,TensorFlow还提供实用的可视化工具: TensorBoard。
TensorBoard是一个TensorFlow提供的很棒的可视化工具。原理很简单:
在你的TensorFlow python代码中用tf.train.SummaryWriter()方法记录下流图的一些信息和event,就会在指定目录生成log文件。生成文件之后,就可以运行:
tensorboard –logdir=/tmp/mnist_logs
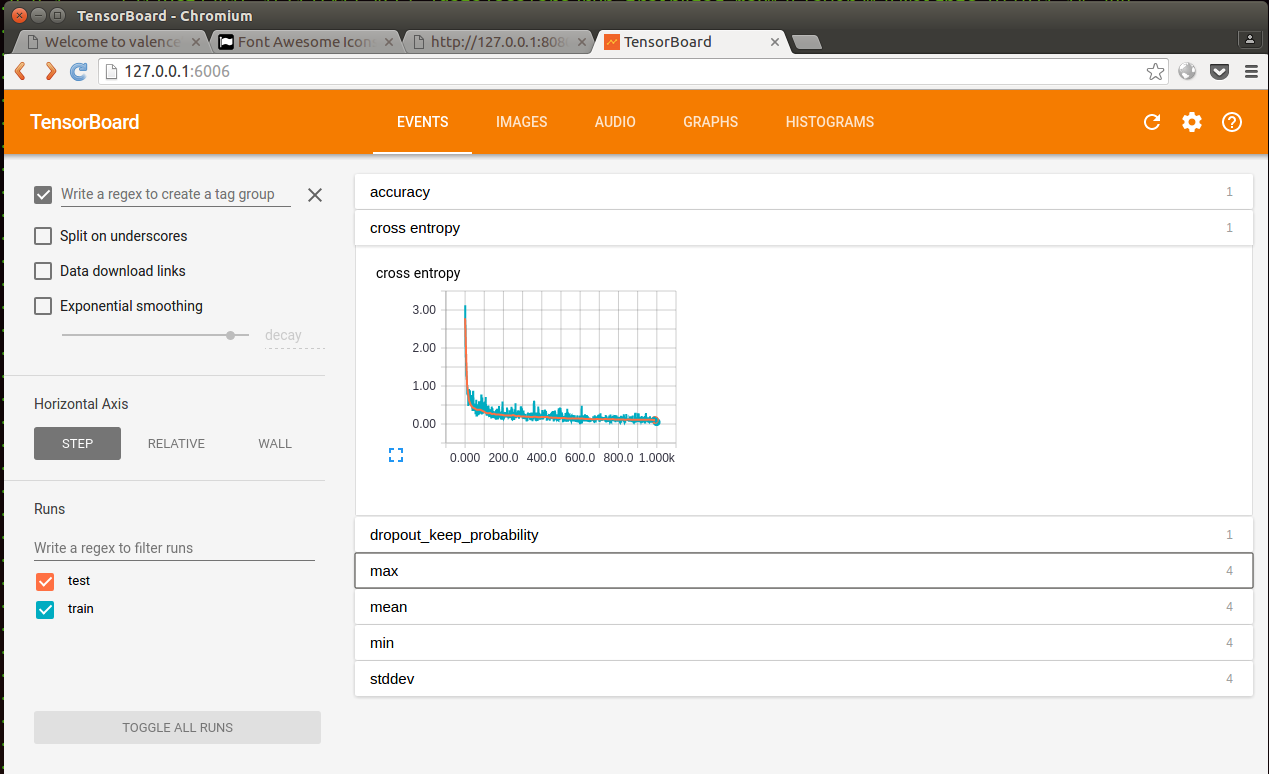
这里mnist_logs就是生成log文件的目录,默认tensorboard就会打开6006端口你的tensorboard网页就出现啦:
里面的数值图都已经为你做好,功能简直是应有尽有。
只要在python代码中把该有的log打下, tensorboard里面就能显示很多数值啦。并且我测试过,正在训练的数据,tensorboard也能显示,不需要等训练完毕再看tensorboard。
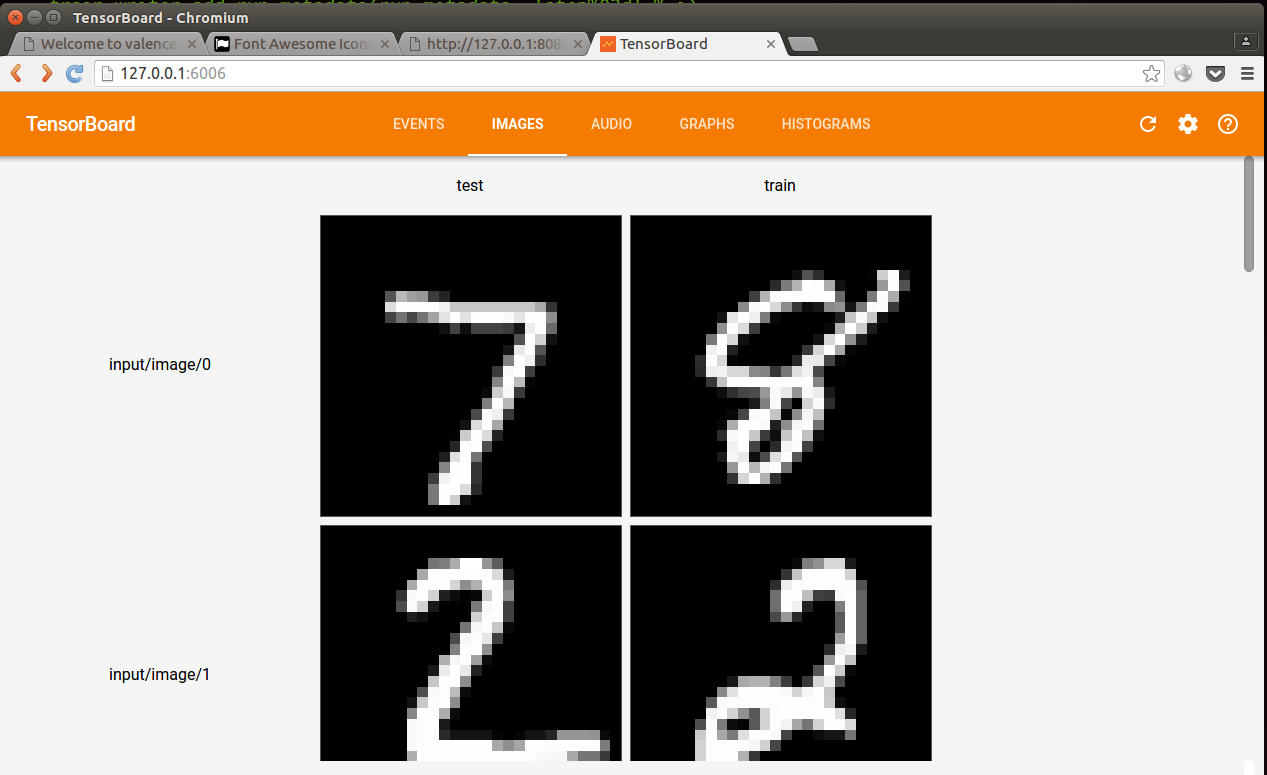
甚至还有输入数据展示:
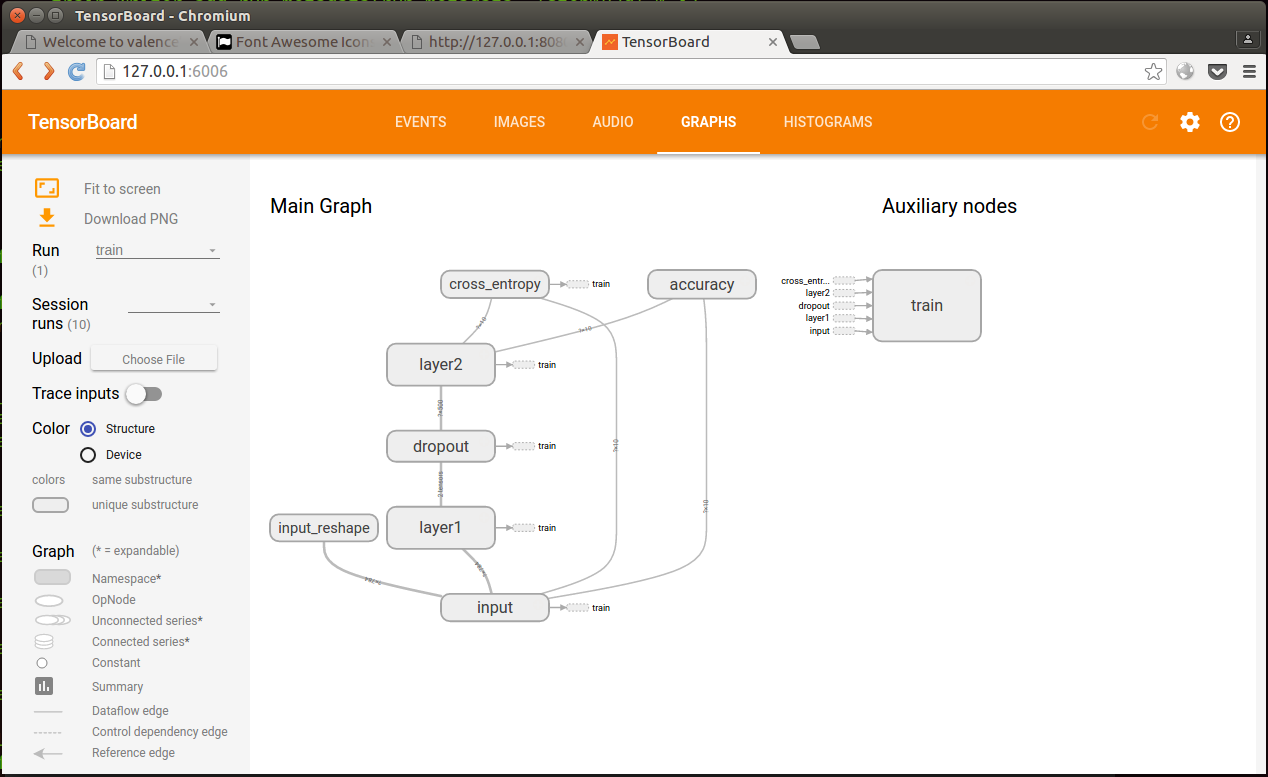
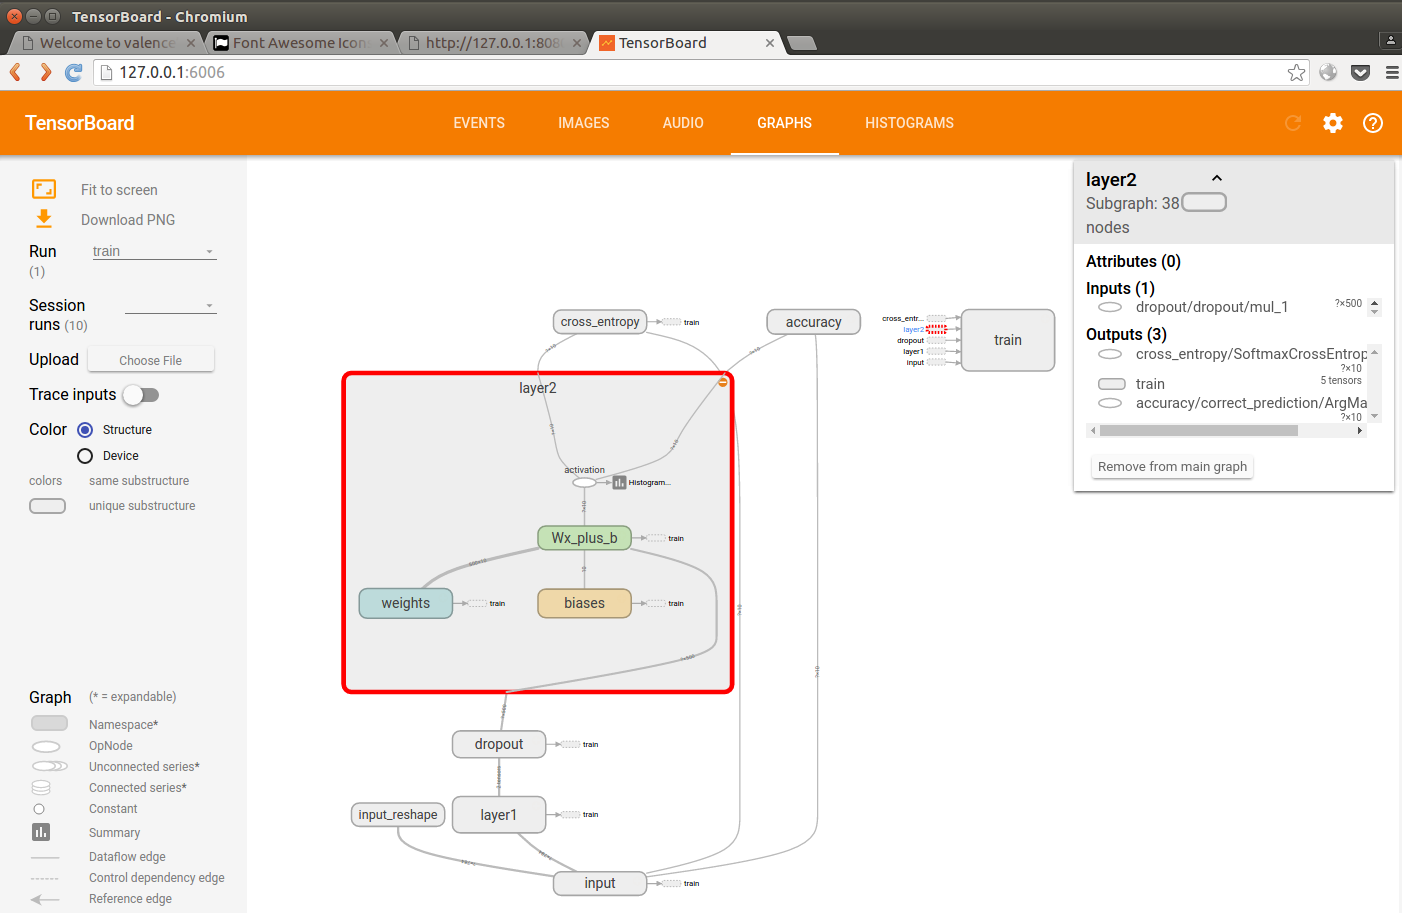
当然,流图可视化少不了啊:
这个流图还能放大,查看内部操作:
棒棒的,有没有~
想试一把吗?赶紧去官网试下例子吧:https://www.tensorflow.org/versions/r0.11/how_tos/summaries_and_tensorboard/index.html
最后附上文章的完整代码例子:
完整可运行代码tensorflow_mlp.py :
import tensorflow as tf
from tensorflow.examples.tutorials.mnist import input_data

# Download and extract the MNIST data set.
# Retrieve the labels as one-hot-encoded vectors.
mnist = input_data.read_data_sets("/tmp/mnist", one_hot=True)

graph = tf.Graph()
# Set our graph as the one to add nodes to
with graph.as_default():
    # Placeholder for input examples (None = variable dimension)
    examples = tf.placeholder(shape=[None, 784], dtype=tf.float32)
    # Placeholder for labels
    labels = tf.placeholder(shape=[None, 10], dtype=tf.float32)

    weights = tf.Variable(tf.truncated_normal(shape=[784, 10], stddev=0.1))
    bias = tf.Variable(tf.constant(0.05, shape=[10]))
    # Apply an affine transformation to the input features
    logits = tf.matmul(examples, weights) + bias
    estimates = tf.nn.softmax(logits)
    # Compute the cross-entropy
    cross_entropy = -tf.reduce_sum(labels * tf.log(estimates),
    reduction_indices=[1])
    # And finally the loss
    loss = tf.reduce_mean(cross_entropy)
    # Create a gradient-descent optimizer that minimizes the loss.
    # We choose a learning rate of 0.01
    optimizer = tf.train.GradientDescentOptimizer(0.05).minimize(loss)
    # Find the indices where the predictions were correct
    correct_predictions = tf.equal(tf.argmax(estimates, dimension=1),
    tf.argmax(labels, dimension=1))
    accuracy = tf.reduce_mean(tf.cast(correct_predictions,
    tf.float32))

with tf.Session(graph=graph) as session:
    tf.initialize_all_variables().run()
    for step in range(100001):
        example_batch, label_batch = mnist.train.next_batch(100)
        feed_dict = {examples: example_batch, labels:
        label_batch}
        if step % 100 == 0:
            _, loss_value, accuracy_value = session.run(
            [optimizer, loss, accuracy],
            feed_dict=feed_dict
            )
            print("Loss at time {0}: {1}".format(step,
            loss_value))
            print("Accuracy at time {0}:{1}".format(step, accuracy_value))
            print('\n')
        else:
            optimizer.run(feed_dict)
参考文献:
https://arxiv.org/pdf/1610.01178v1.pdf
附论文下载:
 Loading...
David 9
Latest posts by David 9 (see all)
- 修订特征已经变得切实可行, “特征矫正工程”是否会成为潮流? - 27 3 月, 2024
- 量子计算系列#2 : 量子机器学习与量子深度学习补充资料,QML,QeML,QaML - 29 2 月, 2024
- “现象意识”#2:用白盒的视角研究意识和大脑,会是什么景象?微意识,主体感,超心智,意识中层理论 - 16 2 月, 2024
