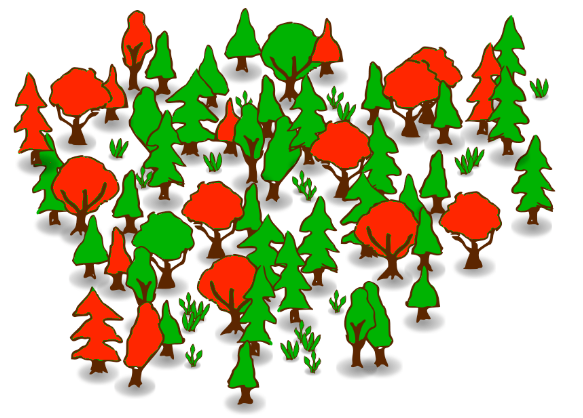
林子大了,什么“树”都有 !
最近神经网络被学界和业界都玩坏了。之前David 9也跟风一连几篇神经网络的文章。神经网络确实到了一个新高度,其他机器学习算法在目前甚至十年以内显得黯然失色。
但是,David 9不希望大家错过其他也很棒的机器学习算法比如随机森林。虽然不如神经网络在某些领域光芒万丈,随机森林因为其方便快捷的使用,以及训练模型的简单,目前依旧深受许多数据科学家的喜爱。
如果你的老板有一堆数据,想做数据挖掘,想找一点“高大上”的算法而且容易实现,选随机森林吧。不仅比神经网络门栏低,而且对于大多数情况的数据形式,都是可以训练的。而且,有时结果好的让你惊讶。
随机森林是集成学习中的一种算法。下面这张图带大家回顾集成学习:
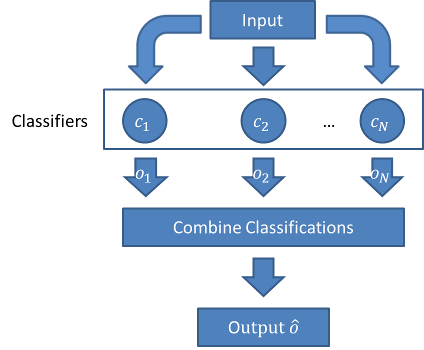
之所以叫做随机森林,很明显,这个模型是通过许多决策树集成学习而来的。集成学习是啥?如果你还不知道,请看我们之前的博客:“#3 集成学习–机器学习中的群策群力 !”和“聊聊集成学习和”多样性”, “差异性”的那些事儿~”。
简单地说就是,我们训练很多很多不同的决策树,这些决策树在训练时选的特征子集不一样,于是这些决策树在做预测和回归时,准确率各不相同。但是,我们在每次预测时,找到哪些表现最好的“树”,这样,“森林”的作用就体现出来了。
真是,林子大了,什么“树”都有 !
对于一些样本,森林中就是有一些决策树的表现良好!
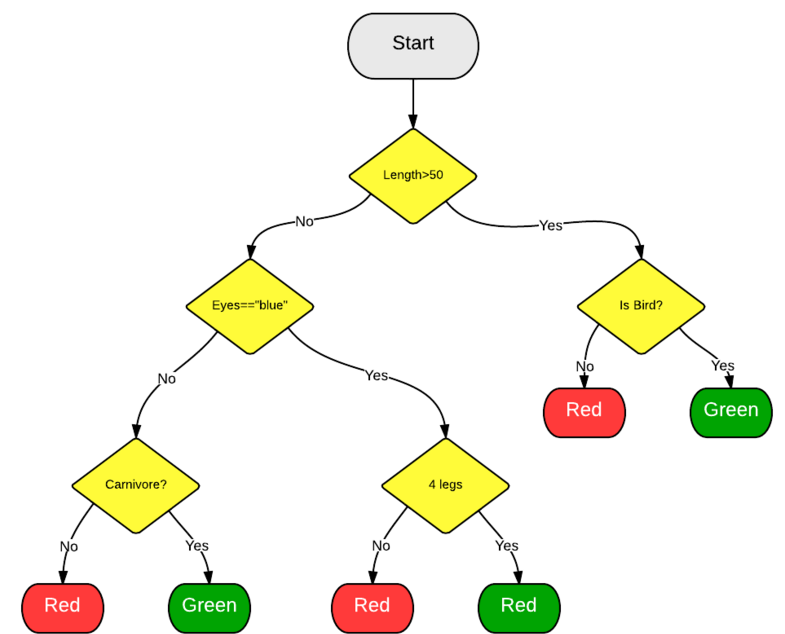
其中每棵决策树各自有不同的分裂方法(根据不同特征子集, 这种集成学习也叫特征子集bagging算法), 最后, 这些不同的决策树进行投票得出最后结果. 一棵决策树判断过程大致如下:
接下来我们就用一段简单的python代码训练一个随机森林(来自scikit-learn例子程序) :
====================================================================
Plot the decision surfaces of ensembles of trees on the iris dataset
====================================================================

Plot the decision surfaces of forests of randomized trees trained on pairs of
features of the iris dataset.

This plot compares the decision surfaces learned by a decision tree classifier
(first column), by a random forest classifier (second column), by an extra-
trees classifier (third column) and by an AdaBoost classifier (fourth column).

In the first row, the classifiers are built using the sepal width and the sepal
length features only, on the second row using the petal length and sepal length
only, and on the third row using the petal width and the petal length only.

In descending order of quality, when trained (outside of this example) on all
4 features using 30 estimators and scored using 10 fold cross validation, we see::

    ExtraTreesClassifier()  # 0.95 score
    RandomForestClassifier()  # 0.94 score
    AdaBoost(DecisionTree(max_depth=3))  # 0.94 score
    DecisionTree(max_depth=None)  # 0.94 score

Increasing `max_depth` for AdaBoost lowers the standard deviation of the scores (but
the average score does not improve).

See the console's output for further details about each model.

In this example you might try to:

1) vary the ``max_depth`` for the ``DecisionTreeClassifier`` and
   ``AdaBoostClassifier``, perhaps try ``max_depth=3`` for the
   ``DecisionTreeClassifier`` or ``max_depth=None`` for ``AdaBoostClassifier``
2) vary ``n_estimators``

It is worth noting that RandomForests and ExtraTrees can be fitted in parallel
on many cores as each tree is built independently of the others. AdaBoost's
samples are built sequentially and so do not use multiple cores.

('DecisionTree with features', [0, 1], 'has a score of', 0.92666666666666664)
('RandomForest with 30 estimators with features', [0, 1], 'has a score of', 0.92666666666666664)
('ExtraTrees with 30 estimators with features', [0, 1], 'has a score of', 0.92666666666666664)
('AdaBoost with 30 estimators with features', [0, 1], 'has a score of', 0.83999999999999997)
('DecisionTree with features', [0, 2], 'has a score of', 0.99333333333333329)
('RandomForest with 30 estimators with features', [0, 2], 'has a score of', 0.99333333333333329)
('ExtraTrees with 30 estimators with features', [0, 2], 'has a score of', 0.99333333333333329)
('AdaBoost with 30 estimators with features', [0, 2], 'has a score of', 0.99333333333333329)
('DecisionTree with features', [2, 3], 'has a score of', 0.99333333333333329)
('RandomForest with 30 estimators with features', [2, 3], 'has a score of', 0.99333333333333329)
('ExtraTrees with 30 estimators with features', [2, 3], 'has a score of', 0.99333333333333329)
('AdaBoost with 30 estimators with features', [2, 3], 'has a score of', 0.99333333333333329)
^C
yanchao@yanchao-desktop:~/software/scikit-learn/examples/ensemble$ cat plot_forest_iris.py
"""
====================================================================
Plot the decision surfaces of ensembles of trees on the iris dataset
====================================================================

Plot the decision surfaces of forests of randomized trees trained on pairs of
features of the iris dataset.

This plot compares the decision surfaces learned by a decision tree classifier
(first column), by a random forest classifier (second column), by an extra-
trees classifier (third column) and by an AdaBoost classifier (fourth column).

In the first row, the classifiers are built using the sepal width and the sepal
length features only, on the second row using the petal length and sepal length
only, and on the third row using the petal width and the petal length only.

In descending order of quality, when trained (outside of this example) on all
4 features using 30 estimators and scored using 10 fold cross validation, we see::

    ExtraTreesClassifier()  # 0.95 score
    RandomForestClassifier()  # 0.94 score
    AdaBoost(DecisionTree(max_depth=3))  # 0.94 score
    DecisionTree(max_depth=None)  # 0.94 score

Increasing `max_depth` for AdaBoost lowers the standard deviation of the scores (but
the average score does not improve).

See the console's output for further details about each model.

In this example you might try to:

1) vary the ``max_depth`` for the ``DecisionTreeClassifier`` and
   ``AdaBoostClassifier``, perhaps try ``max_depth=3`` for the
   ``DecisionTreeClassifier`` or ``max_depth=None`` for ``AdaBoostClassifier``
2) vary ``n_estimators``

It is worth noting that RandomForests and ExtraTrees can be fitted in parallel
on many cores as each tree is built independently of the others. AdaBoost's
samples are built sequentially and so do not use multiple cores.
"""
print(__doc__)

import numpy as np
import matplotlib.pyplot as plt

from sklearn import clone
from sklearn.datasets import load_iris
from sklearn.ensemble import (RandomForestClassifier, ExtraTreesClassifier,
                              AdaBoostClassifier)
from sklearn.externals.six.moves import xrange
from sklearn.tree import DecisionTreeClassifier

# Parameters
n_classes = 3
n_estimators = 30
plot_colors = "ryb"
cmap = plt.cm.RdYlBu
plot_step = 0.02  # fine step width for decision surface contours
plot_step_coarser = 0.5  # step widths for coarse classifier guesses
RANDOM_SEED = 13  # fix the seed on each iteration

# Load data
iris = load_iris()

plot_idx = 1

models = [DecisionTreeClassifier(max_depth=None),
          RandomForestClassifier(n_estimators=n_estimators),
          ExtraTreesClassifier(n_estimators=n_estimators),
          AdaBoostClassifier(DecisionTreeClassifier(max_depth=3),
                             n_estimators=n_estimators)]

for pair in ([0, 1], [0, 2], [2, 3]):
    for model in models:
        # We only take the two corresponding features
        X = iris.data[:, pair]
        y = iris.target

        # Shuffle
        idx = np.arange(X.shape[0])
        np.random.seed(RANDOM_SEED)
        np.random.shuffle(idx)
        X = X[idx]
        y = y[idx]

        # Standardize
        mean = X.mean(axis=0)
        std = X.std(axis=0)
        X = (X - mean) / std

        # Train
        clf = clone(model)
        clf = model.fit(X, y)

        scores = clf.score(X, y)
        # Create a title for each column and the console by using str() and
        # slicing away useless parts of the string
        model_title = str(type(model)).split(".")[-1][:-2][:-len("Classifier")]
        model_details = model_title
        if hasattr(model, "estimators_"):
            model_details += " with {} estimators".format(len(model.estimators_))
        print( model_details + " with features", pair, "has a score of", scores )

        plt.subplot(3, 4, plot_idx)
        if plot_idx <= len(models):
            # Add a title at the top of each column
            plt.title(model_title)

        # Now plot the decision boundary using a fine mesh as input to a
        # filled contour plot
        x_min, x_max = X[:, 0].min() - 1, X[:, 0].max() + 1
        y_min, y_max = X[:, 1].min() - 1, X[:, 1].max() + 1
        xx, yy = np.meshgrid(np.arange(x_min, x_max, plot_step),
                             np.arange(y_min, y_max, plot_step))

        # Plot either a single DecisionTreeClassifier or alpha blend the
        # decision surfaces of the ensemble of classifiers
        if isinstance(model, DecisionTreeClassifier):
            Z = model.predict(np.c_[xx.ravel(), yy.ravel()])
            Z = Z.reshape(xx.shape)
            cs = plt.contourf(xx, yy, Z, cmap=cmap)
        else:
            # Choose alpha blend level with respect to the number of estimators
            # that are in use (noting that AdaBoost can use fewer estimators
            # than its maximum if it achieves a good enough fit early on)
            estimator_alpha = 1.0 / len(model.estimators_)
            for tree in model.estimators_:
                Z = tree.predict(np.c_[xx.ravel(), yy.ravel()])
                Z = Z.reshape(xx.shape)
                cs = plt.contourf(xx, yy, Z, alpha=estimator_alpha, cmap=cmap)

        # Build a coarser grid to plot a set of ensemble classifications
        # to show how these are different to what we see in the decision
        # surfaces. These points are regularly space and do not have a black outline
        xx_coarser, yy_coarser = np.meshgrid(np.arange(x_min, x_max, plot_step_coarser),
                                             np.arange(y_min, y_max, plot_step_coarser))
        Z_points_coarser = model.predict(np.c_[xx_coarser.ravel(), yy_coarser.ravel()]).reshape(xx_coarser.shape)
        cs_points = plt.scatter(xx_coarser, yy_coarser, s=15, c=Z_points_coarser, cmap=cmap, edgecolors="none")

        # Plot the training points, these are clustered together and have a
        # black outline
        for i, c in zip(xrange(n_classes), plot_colors):
            idx = np.where(y == i)
            plt.scatter(X[idx, 0], X[idx, 1], c=c, label=iris.target_names[i],
                        cmap=cmap)

        plot_idx += 1  # move on to the next plot in sequence

plt.suptitle("Classifiers on feature subsets of the Iris dataset")
plt.axis("tight")

plt.show()
训练结果与其他算法比较如下:
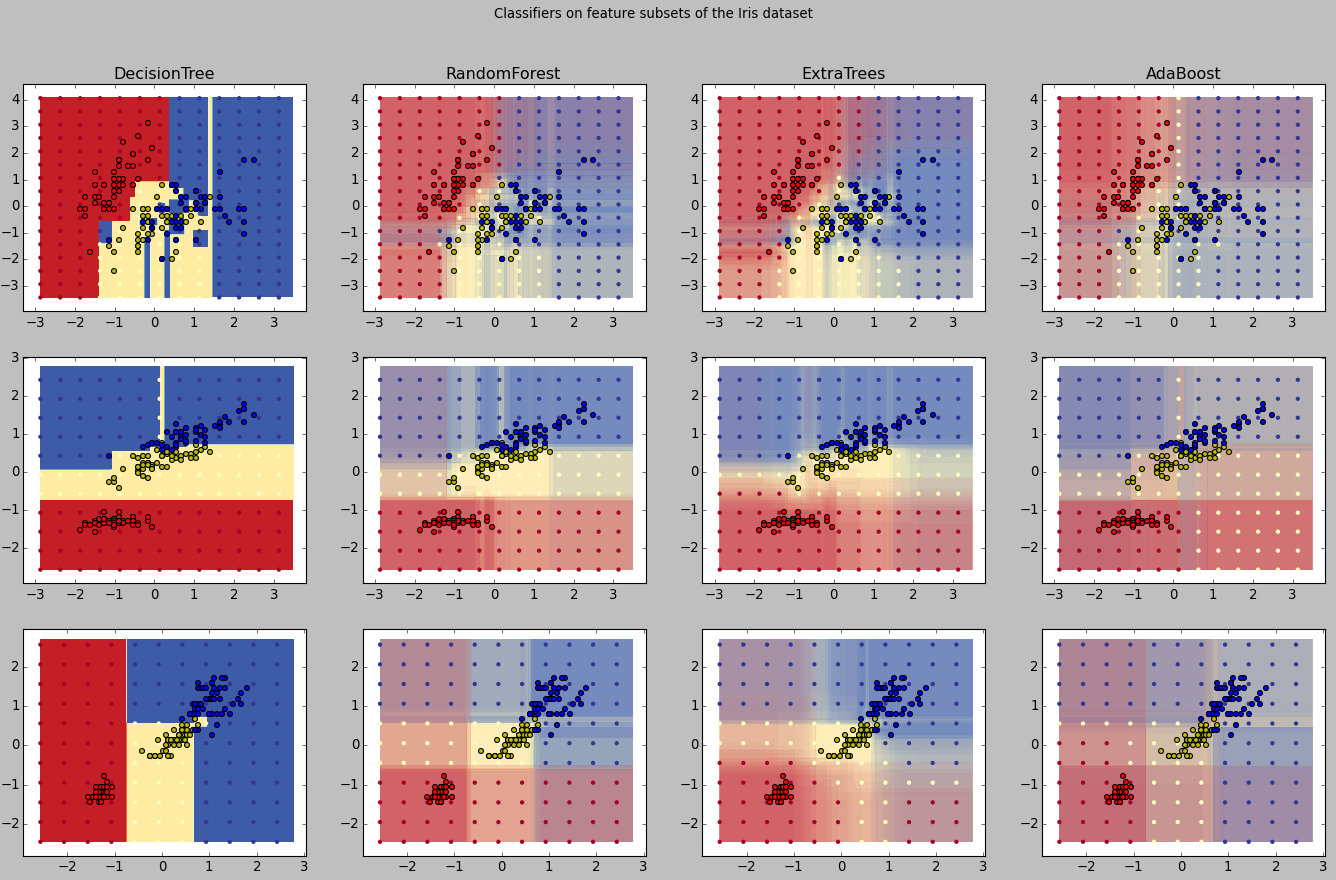
是不是感觉和Adaboot一样好用啊 ? 可以在你手边的数据一试身手哦~
参考文献:
- https://en.wikipedia.org/wiki/Random_forest
-
本文章属于“David 9的博客”原创,如需转载,请联系微信yanchao727727,或邮箱:yanchao727@gmail.com
David 9
Latest posts by David 9 (see all)
- 修订特征已经变得切实可行, “特征矫正工程”是否会成为潮流? - 27 3 月, 2024
- 量子计算系列#2 : 量子机器学习与量子深度学习补充资料,QML,QeML,QaML - 29 2 月, 2024
- “现象意识”#2:用白盒的视角研究意识和大脑,会是什么景象?微意识,主体感,超心智,意识中层理论 - 16 2 月, 2024
赞!